Katello 3.17 Documentation
Tracer
Tracer displays a list of services and applications that are outdated and need to be restarted.
Additional documentation around the Tracer appliaction can be found here
Using Tracer
- Installing Tracer
- Viewing traces for a content host in the UI
- Viewing traces for a host with the CLI
- Resolving traces for a single content host
- Resolving traces on multiple content hosts
Installing Tracer
With the CLI
Make sure that the “Katello Client Release Package” repository is installed and enabled on the client, then install the katello-host-tools-tracer package:
# yum install katello-host-tools-tracer
Run the katello-tracer-upload command, which will upload the Tracer data to the Katello server:
# katello-tracer-upload
With the UI
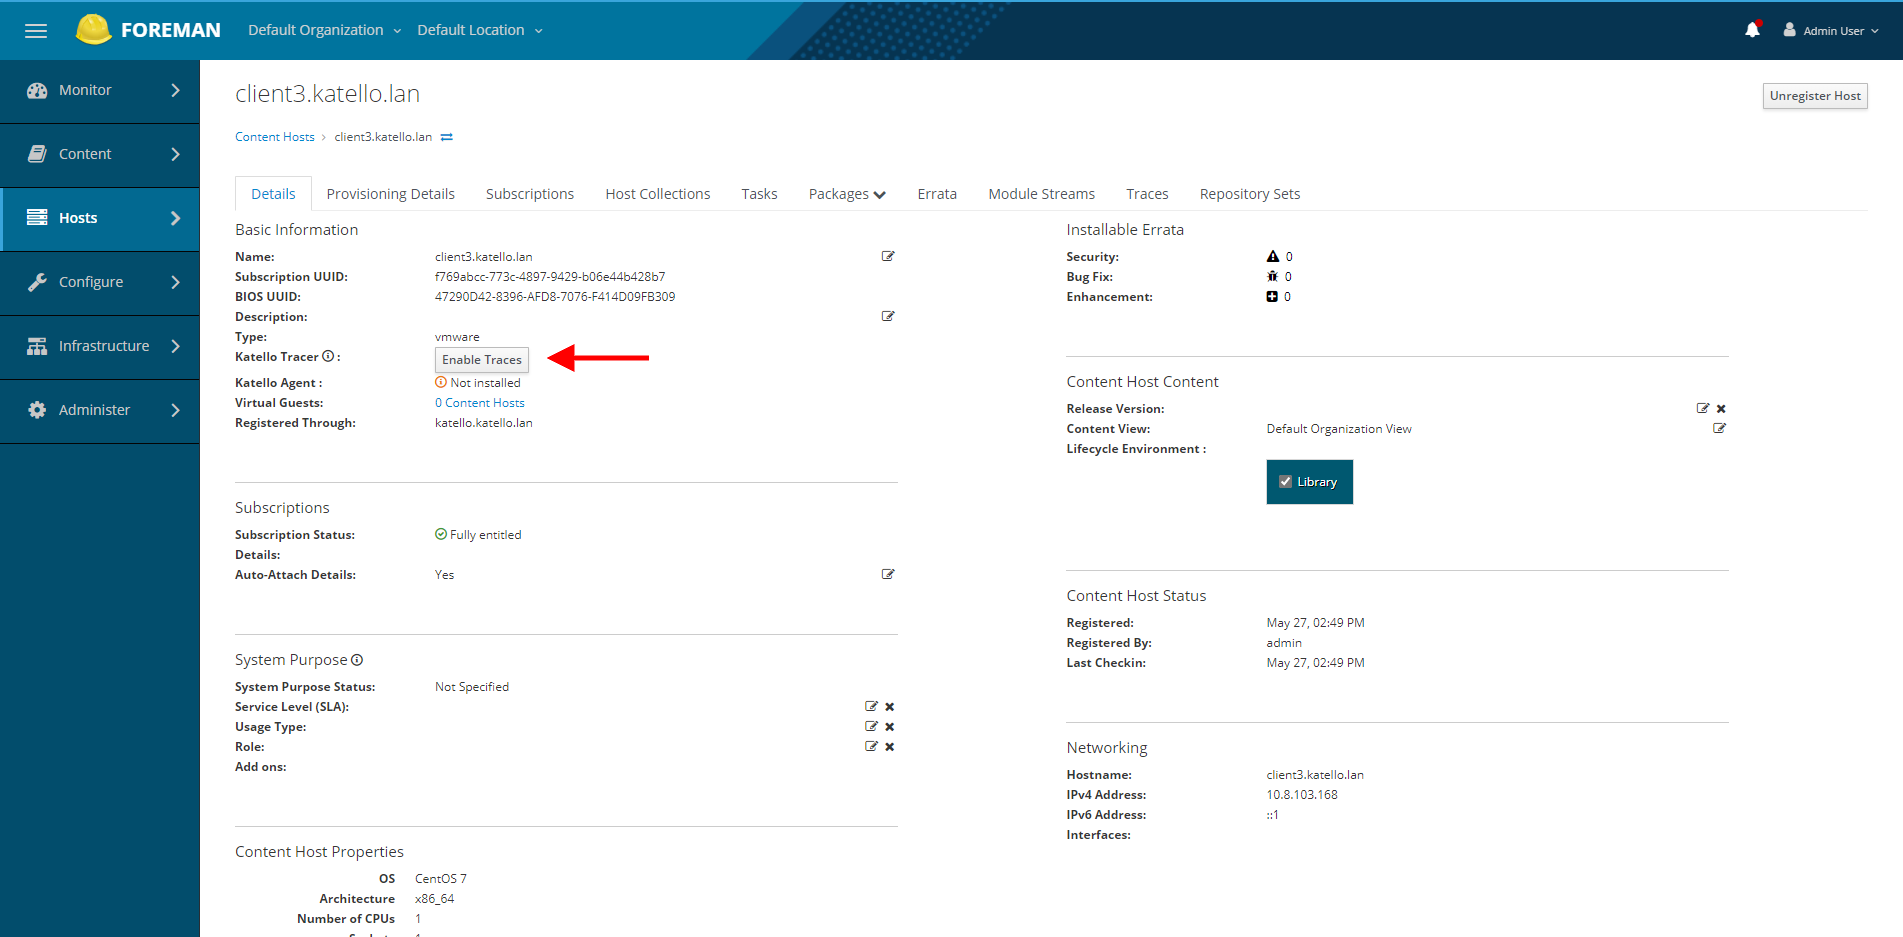
Go to “Hosts” - “Content Hosts” in the Katello UI. Click on the host name you will be installing Tracer on, click the button labeled “Enable Traces”:
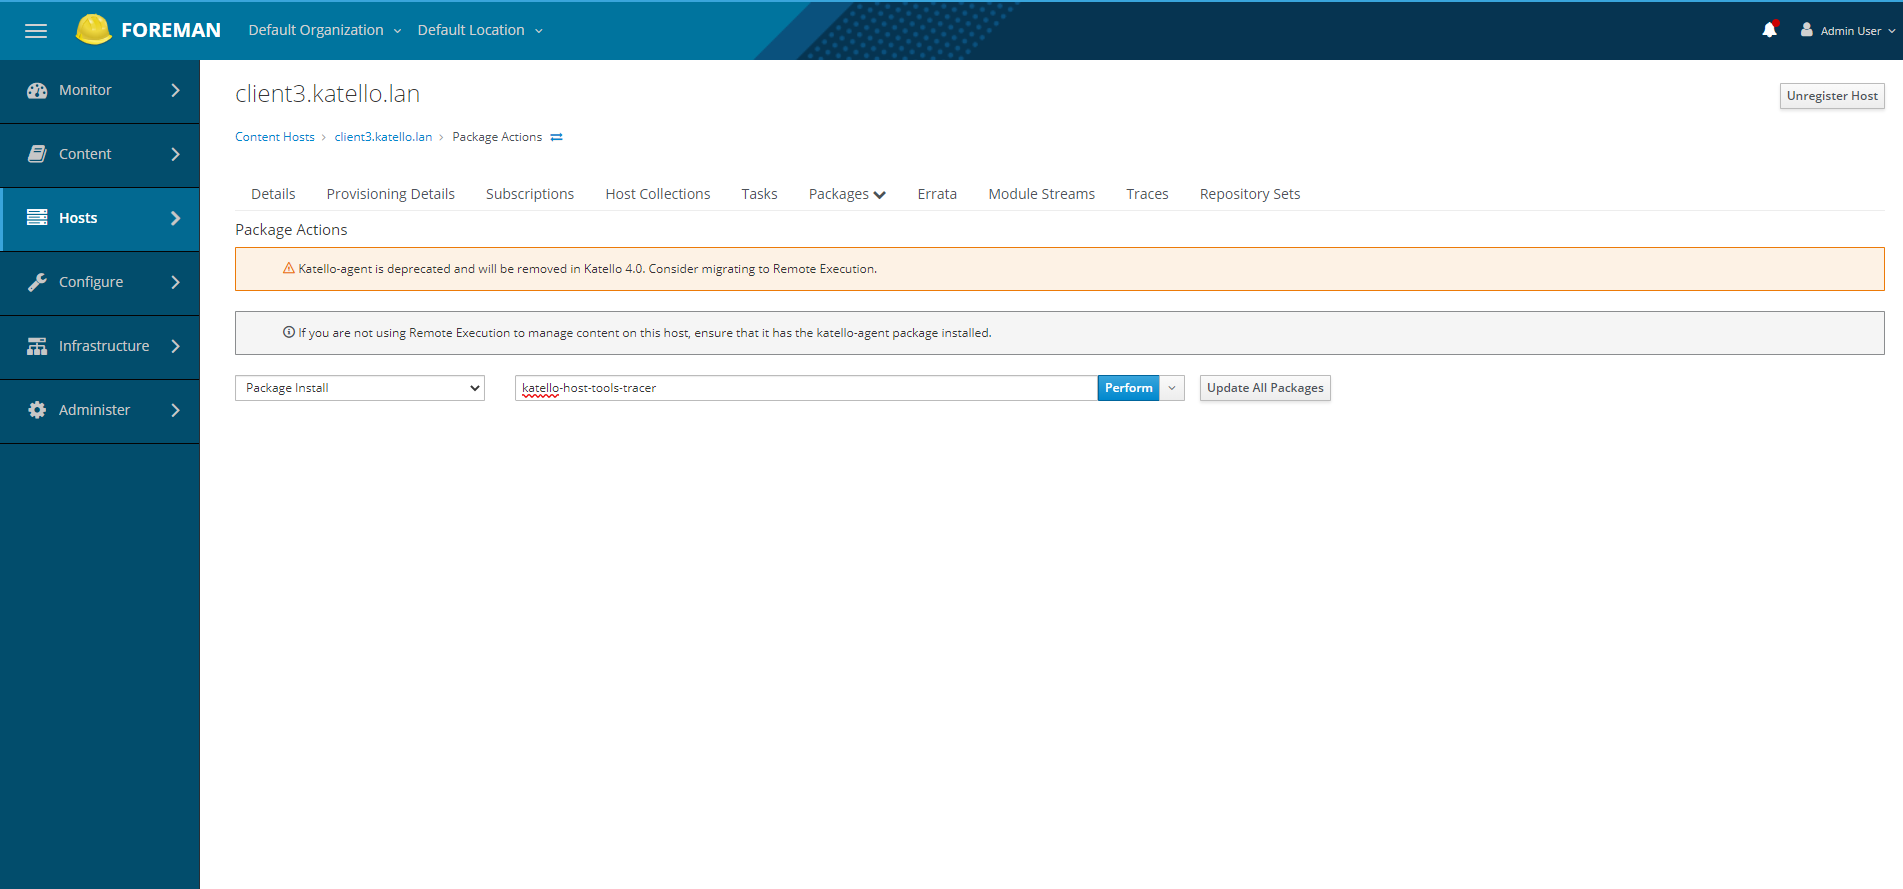
Clicking “Enable Traces” on the host will take you to the Package Actions page to confirm installing the katello-host-tools-tracer package:
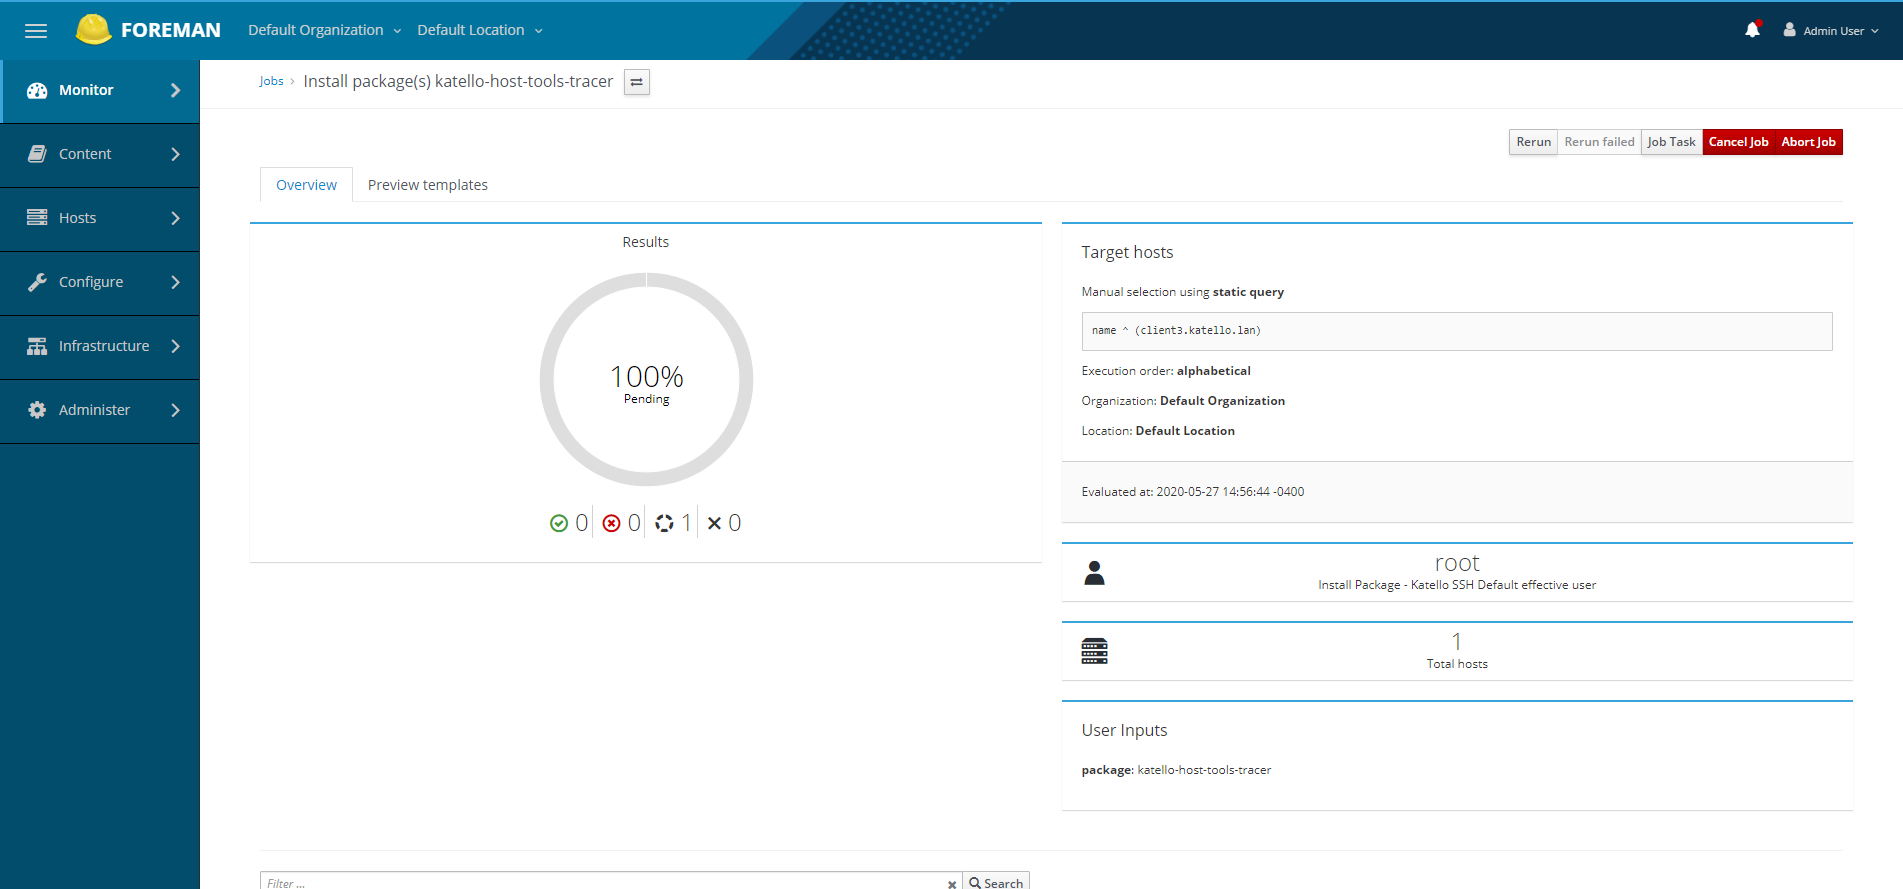
Clicking “Perform” will kick off a Remote Execution job to install the katello-host-tools-tracer package:
Viewing traces for a content host in the UI
To verify that Katello is receiving Tracer information from the client, within the Katello UI, go to “Hosts” - “All hosts”, and click on the name of the host that Tracer was installed on.
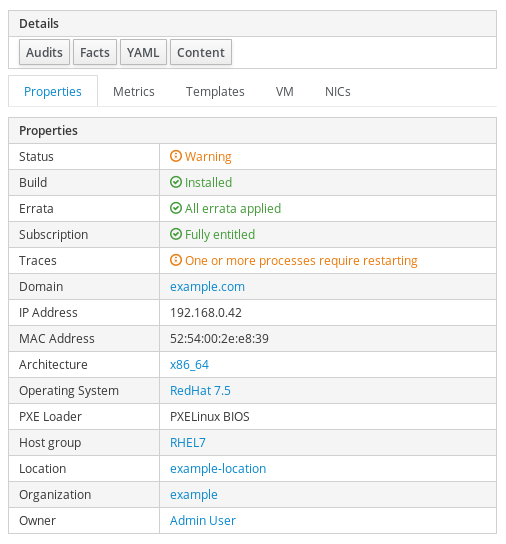
The host should now have a “Traces” property:
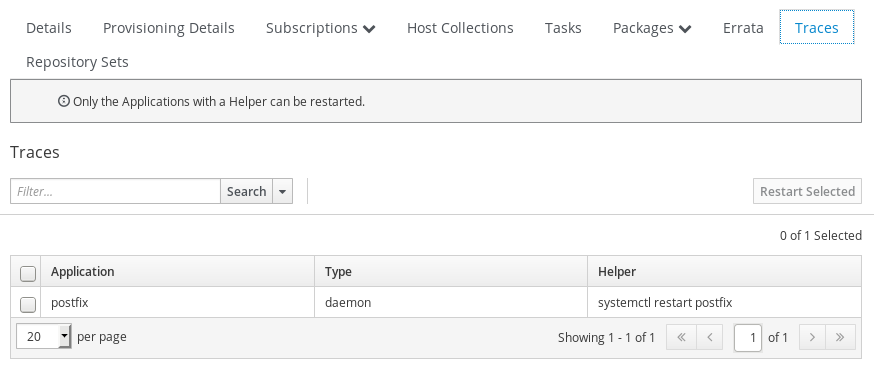
Go to “Hosts” - “Content Hosts” in the Katello UI. Click on the host name, and go to the “Traces” tab to see more details:
Viewing traces with the CLI
To list all hosts and see the trace status
# hammer host list --fields id,name,trace status
---|---------------------|----------------
ID | NAME                | TRACE STATUS
---|---------------------|----------------
2  | client1.katello.lan | Reboot required
3  | client2.katello.lan | Reboot required
1  | katello.katello.lan |
---|---------------------|----------------
To look at a host in detail and see the trace status
# hammer host info --id 1
Id:                       1
Name:                     centos7.thinkstation.example.com
Organization:             Default Organization
Location:                 Default Location
Cert name:                centos7.thinkstation.example.com
Managed:                  no
Installed at:
Last report:
Uptime (seconds):         329570
Status:
    Global Status: Error
Network:
    IPv4 address: 192.168.121.249
    MAC:          52:54:00:00:85:7f
Network interfaces:
 1) Id:           1
    Identifier:   eth0
    Type:         interface (primary, provision)
    MAC address:  52:54:00:00:85:7f
    IPv4 address: 192.168.121.249
    FQDN:         centos7.thinkstation.example.com
Operating system:
    Architecture:           x86_64
    Operating System:       CentOS 7
    Build:                  no
    Custom partition table:
Subscription Information:
    UUID:            f3a4de5f-0ff3-40b9-828f-ee1fb3ef6337
    Last Checkin:    2020-05-15 21:29:34 UTC
    Release Version:
    Autoheal:        true
    Registered To:   centos7-katello-devel-stable.example.com
    Registered At:   2020-05-15 21:25:15 UTC
    System Purpose:
        Service Level:
        Purpose Usage:
        Purpose Role:
        Purpose Addons:
Trace Status:             Reboot required
To get a list of traces for a single host
# hammer host traces list --host-id 1
---------|---------------------|-----------------------------------------|------------
TRACE ID | APPLICATION         | HELPER                                  | TYPE
---------|---------------------|-----------------------------------------|------------
22       | auditd              | sudo systemctl restart auditd           | daemon
35       | bash                | You will have to log out & log in again | session
32       | chronyd             | sudo systemctl restart chronyd          | daemon
34       | crond               | sudo systemctl restart crond            | daemon
39       | dbus                | You will have to reboot your computer   | static
26       | getty@tty1          | You will have to log out & log in again | session
20       | gssproxy            | sudo systemctl restart gssproxy         | daemon
30       | irqbalance          | sudo systemctl restart irqbalance       | daemon
18       | kernel              | You will have to reboot your computer   | static
28       | lvm2-lvmetad        | sudo systemctl restart lvm2-lvmetad     | daemon
29       | NetworkManager      | sudo systemctl restart NetworkManager   | daemon
33       | polkit              | sudo systemctl restart polkit           | daemon
37       | postfix             | sudo systemctl restart postfix          | daemon
19       | rpcbind             | sudo systemctl restart rpcbind          | daemon
24       | rsyslog             | sudo systemctl restart rsyslog          | daemon
36       | sshd                | sudo systemctl restart sshd             | daemon
31       | ssh-vagrant-session | You will have to log out & log in again | session
27       | systemd             | You will have to reboot your computer   | static
---------|---------------------|-----------------------------------------|------------
Resolving traces for a single Content Host
Go to “Hosts” - “Content Hosts” in the Katello UI. Click on the host name, and go to the “Traces” tab to see more details:

Tracer is recommending that rsyslog be restarted. Click the box for rsyslog, then click “Restart Selected”. Katello will kick off a Remote Execution job to restart the rsyslog service.

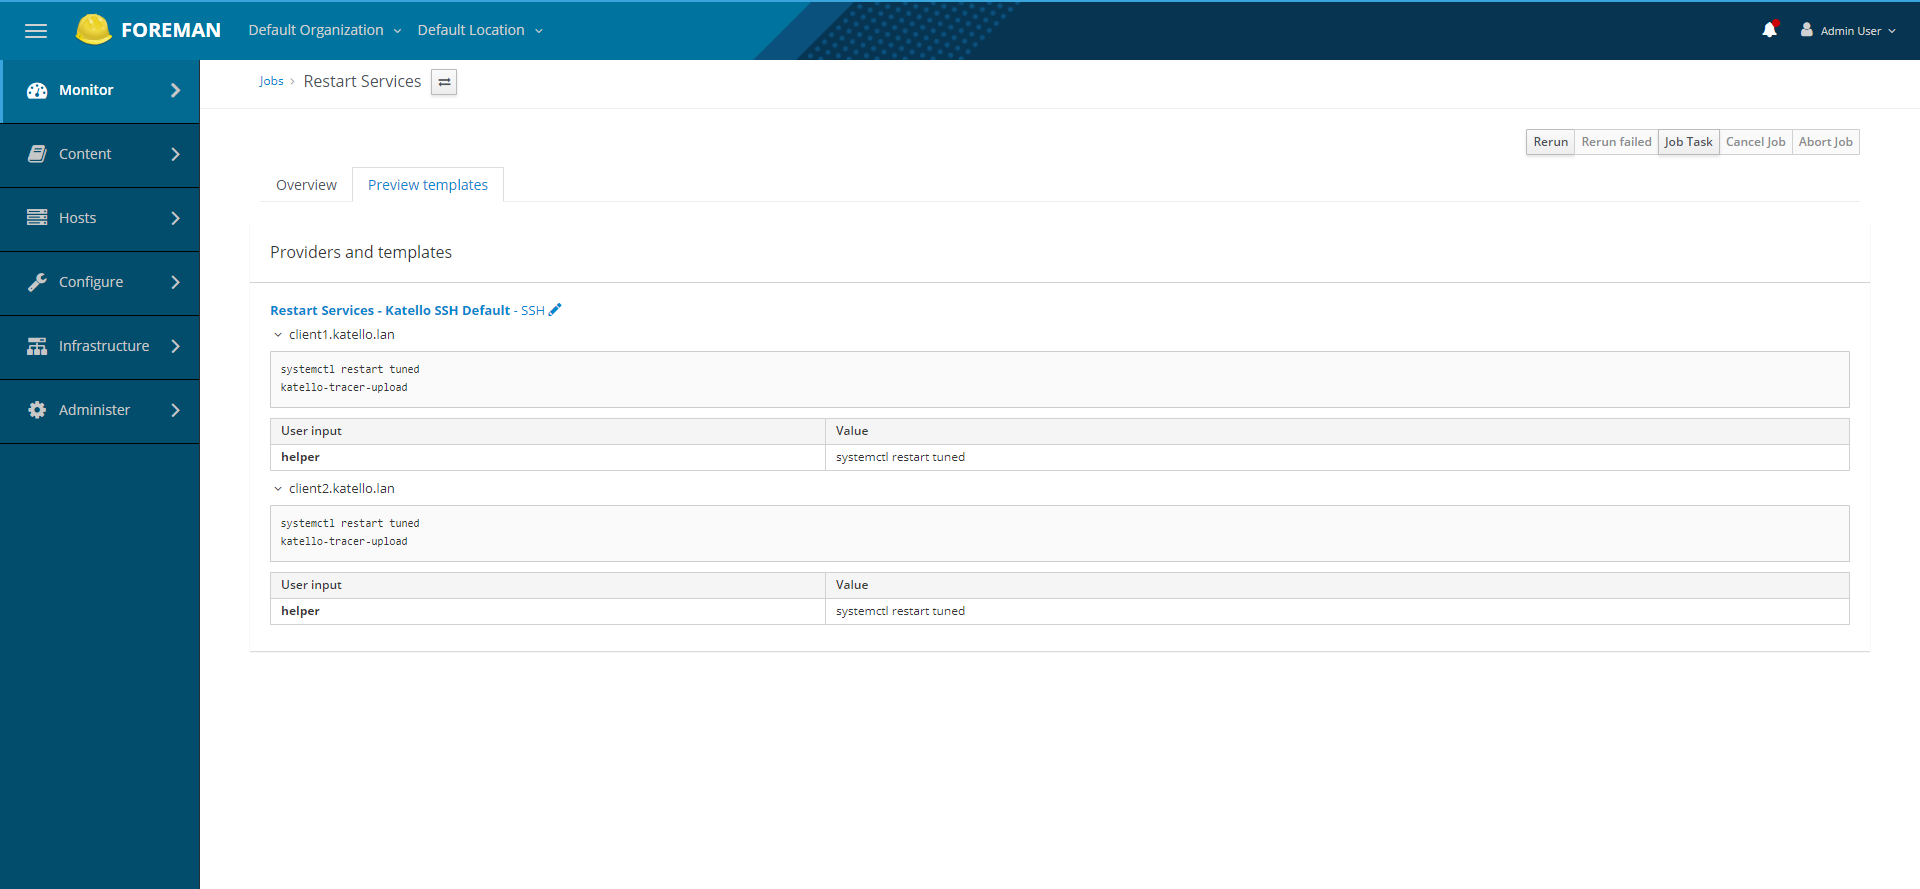
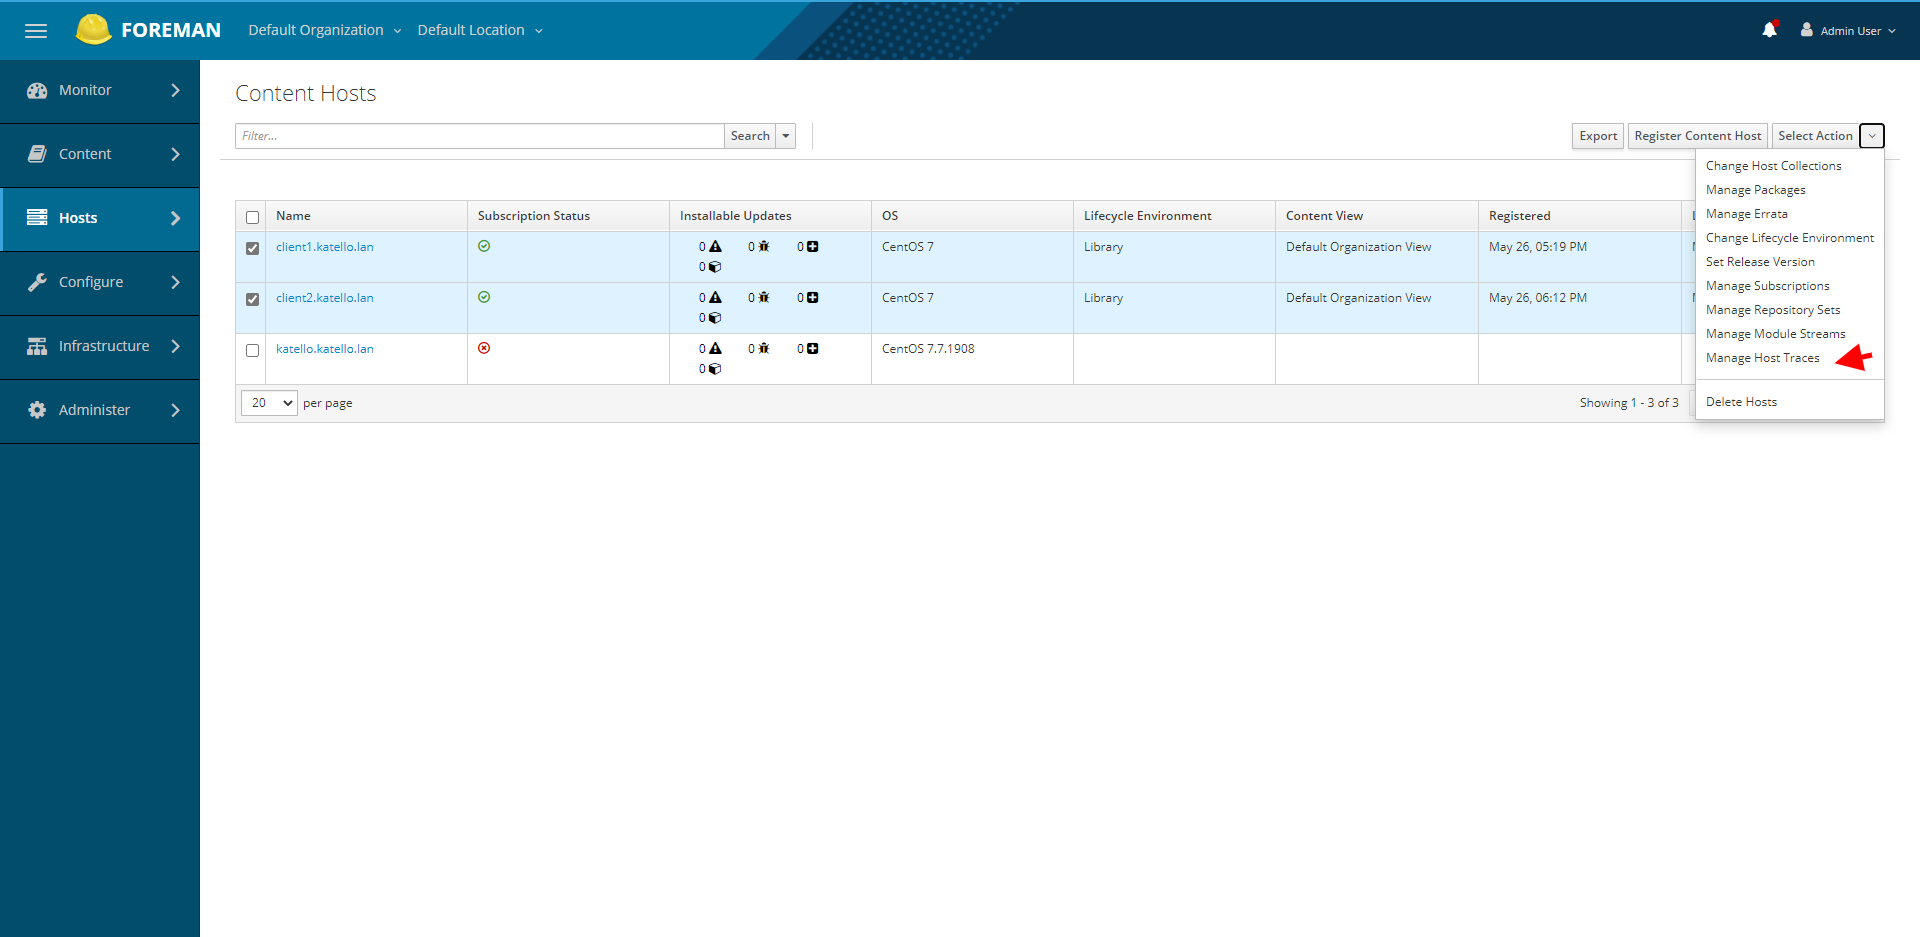
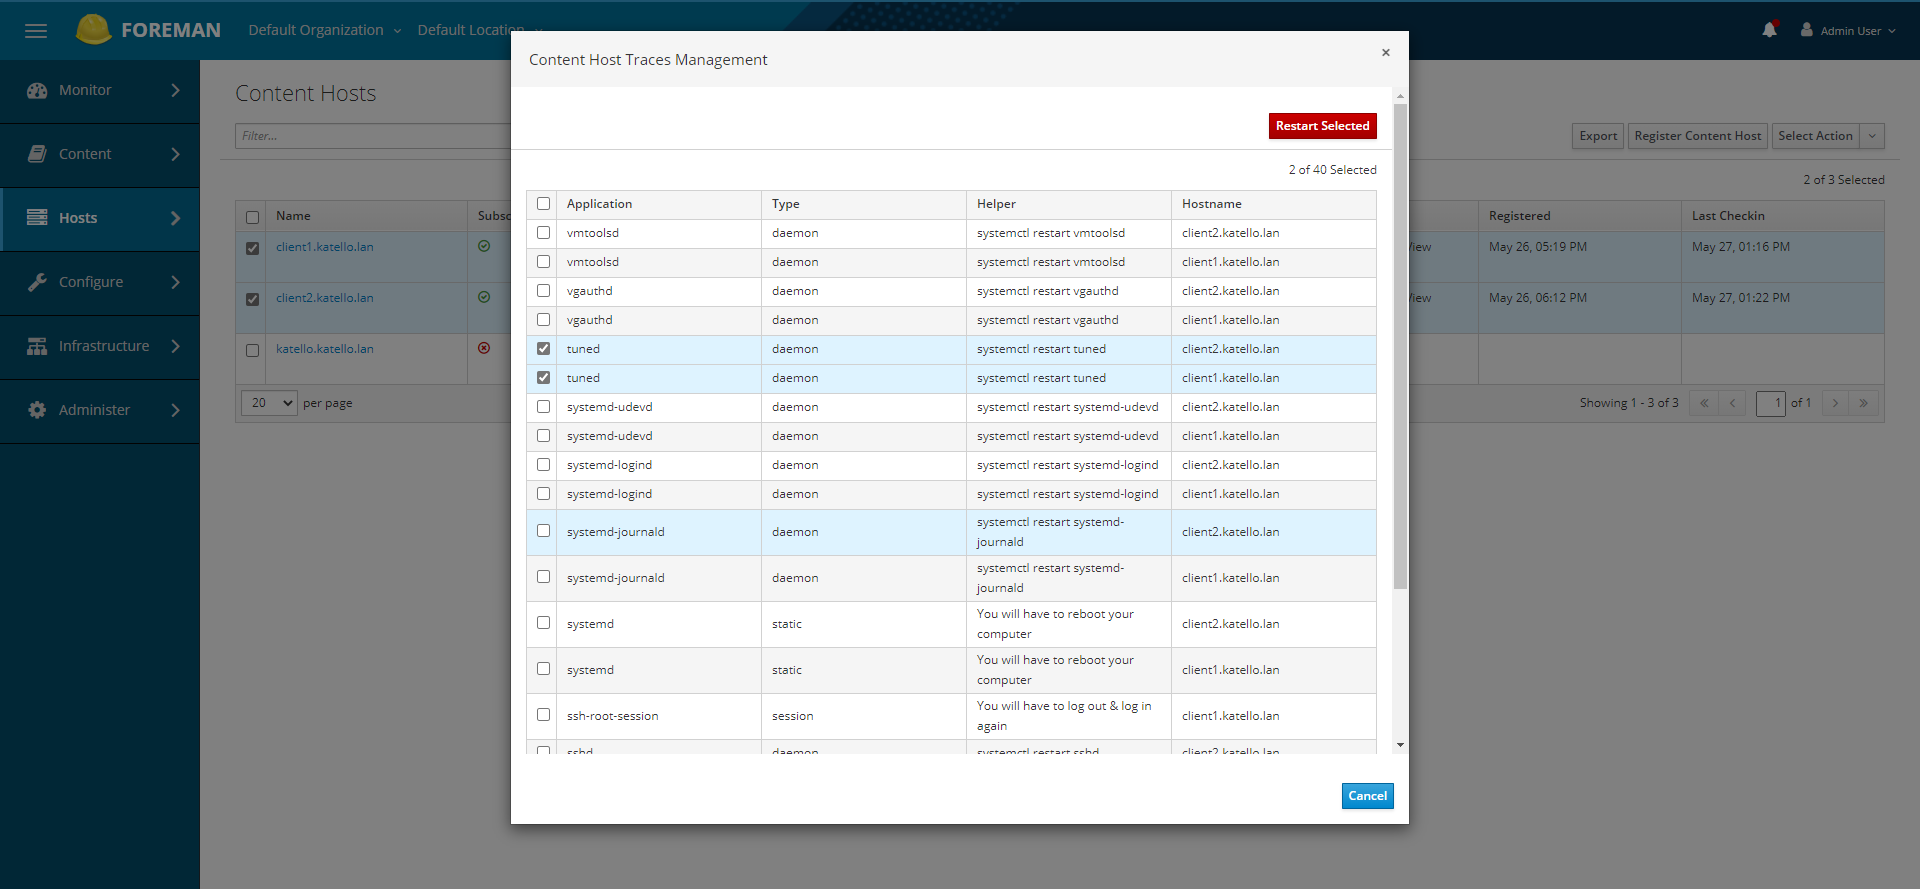
Resolving traces on multiple Content Hosts
Visit Content Hosts and select the hosts you would like to remediate traces on:
Select the services from the list that you want to remediate and click “Restart Selected”:
You will return to the Content Host page with a notification and a link to view the job invocations that have been kicked off with Remote Execution: